Norwegian EV Association · Solo sprint · Four days · March 2026
Does an electric car fit into my life?
A four-day solo sprint for the Norwegian EV Association: a service that helps owners of fossil-fuel cars understand what switching to an electric car would mean for them. The concept, “Your Personal EV Advisor,” starts with a single piece of input: your license plate number.

Enter your plate
One field. Your car is fetched from the Norwegian Public Roads Administration.
See what you save
Costs against the car you drive today.

Simulate your daily life
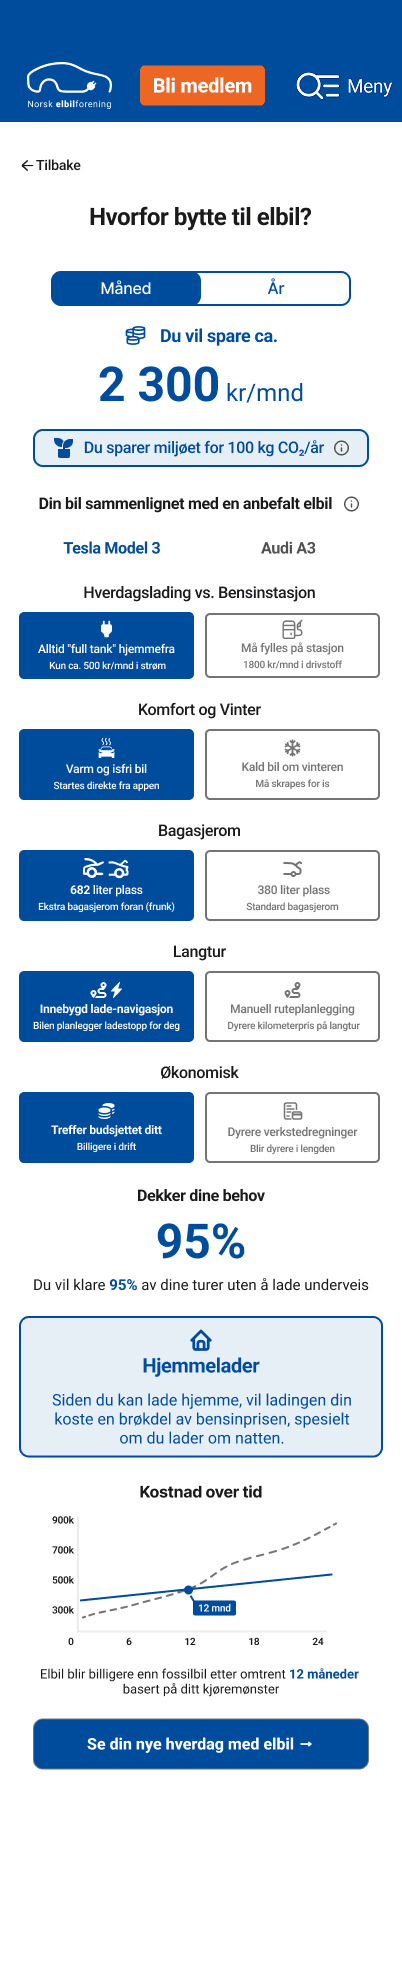
Charging stations, winter mode and range, for you.
01The assignment
Vast amounts of data, and an unsure fossil-car owner
The Electric Vehicle Association has access to vast amounts of electric vehicle data: consumption, prices, technical specifications, and charging networks. The task was to design a service that makes all of this useful for people who are unsure about making the switch from their trusty fossil-fuel car.
I know this user well. My family has owned both fossil-fuel cars and electric cars, and I’ve seen the hesitation up close. It’s rarely about how much horsepower they have or how quiet they are. It’s about “Will my daily life change?” So the service doesn’t present piles of data. It answers one personal question: What would your days look like with an electric car?
Who I designed for
Petter, 33
Primary user
Owns an Audi A3 today, lives in a suburb and commutes to work daily. Unsure about charging and costs.
Says: “I don’t know if an EV pays off for me”
The user journey
From “Is an EV expensive? What about winter?” via Google searches and articles, to the license plate and a comparison with their own car, and “this works for me.”
02My role
Everything, alone, in four days
A solo sprint: problem definition, target group and user journey in FigJam, information architecture, wireframes and a finished prototype in Figma. The deliverables also covered the system side: which data sources feed what, a phased rollout starting with an MVP, and manual entry as a fallback if the license plate lookup were to go down.
- Team
- 1designer, solo
- Tools
- FigmaFigJam
03Design moves
One input, and a language everyday life understands
One field to fill in.
You enter your license plate number. The service retrieves data about your car from the Norwegian Public Roads Administration and builds each comparison around it. No forms, no account, no friction.
A layer of translation.
Technical language becomes lived value. “Heat pump” becomes “a warm, ice-free car every morning.” kWh becomes “always a full tank when leaving home.”
The winter switch.
A switch in the simulation that shows range and charging needs under Norwegian winter conditions. Most electric car marketing avoids this topic. Showing it is what makes the rest credible.
Transparent climate accounting.
Small info icons open explanations of the numbers in plain language, instead of asking people to take them at face value.
The translation layer
The specifications say
Heat pump
kWh consumption
Your daily life hears
A warm and ice-free car every morning
Always a full tank when leaving home
The choice I remember
My first version opened with a long list of questions to map out the user’s needs. It was thorough, and it was boring. I scrapped it and replaced it with a short, interactive flow. The service became simpler and more user-friendly, and nothing important was lost. It sounds like a small change, but it set the tone for the entire concept.
Honest limitations
Four days don’t allow for proper insight work. I relied on informal checks with family and friends who cover both electric and fossil-car experience. With one more week, the first thing I’d do is test the flow on fossil-car owners outside my own circle.
04Behind the screens
Four days, from whiteboard to prototype
It all started on one FigJam board: problem, target group, needs, user journey, concept, features and information architecture, before a single screen was drawn.
- 01
Day 1 · Problem
Board: problem, goals, Petter
- 02
Day 2 · Concept
User journey, features, IA
- 03
Day 3 · Wireframes
Three steps, one flow
- 04
Day 4 · Prototype
Daily life simulator and winter switch
- 05
Next
Test on fossil-car owners
From wireframe to finished screen
Step 1 of 3. The first version opened with a long list of questions. It was scrapped; now it is one field: your license plate.

05Lessons
What went straight into how I work now
01Structure from the first hour
Four days is short. I would have worked even more systematically from the start, with the board as the steering document all the way.
02Sell what it achieves, not what it looks like
More of the time should have gone to presenting what the solution does for Petter, not just the screens.